
Chances of Winning the Lottery: Understanding Your True Odds
Honestly, your chances of winning the lottery are about as slim as they come. Take Powerball, for example—your odds of hitting the jackpot are roughly 1 in 292 million.
So, you’re more likely to get struck by lightning than to win the big prize.
Sure, lottery games have smaller prizes, but most people just win the minimum payout, which usually doesn’t even cover the cost of the ticket. You might think buying more tickets gives you a real boost, but it barely moves the needle for the jackpot.
Each ticket stands alone—one ticket doesn’t help the other.
Understanding these odds can help you make better choices about playing. The thrill of the jackpot is real, but knowing the true odds might keep your expectations in check (and maybe your wallet, too).
Understanding Lottery Odds and Probability
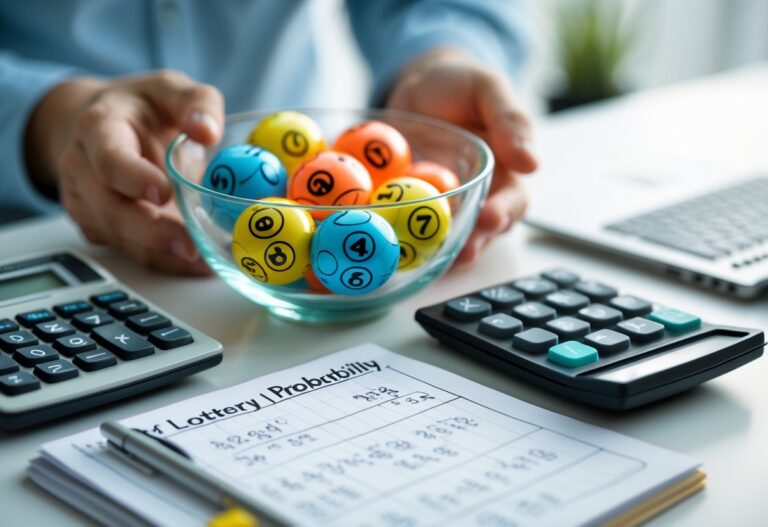
When you get how lottery odds and probability work, you start to see where you stand. The math shows how likely your numbers are to win and how different games compare.
You’ll see how odds are calculated, what combinations mean, and how lotteries stack up against each other.
How Lottery Odds Are Calculated
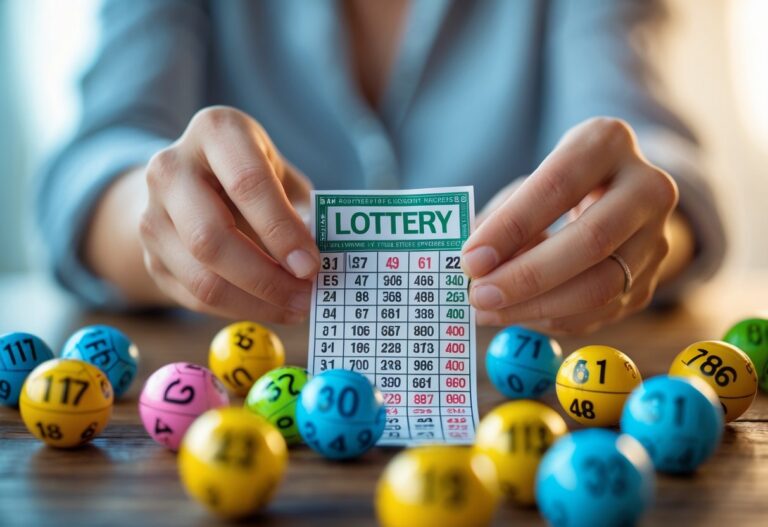
Lottery odds tell you your chance to win a prize. Usually, you’ll see them as a ratio—something like 1 in 14 million.
That means you have just one shot out of 14 million possible outcomes.
To figure out those odds, you count every possible combination of numbers. In a basic 6/49 lottery, you pick 6 out of 49 numbers.
The number of combinations is the key. The formula for combinations looks like this:
C(n, k) = n! / (k! × (n – k)!)
n is the total numbers, and k is how many you pick.
So, for 6/49:
C(49, 6) = 13,983,816 combinations
That’s why the odds of hitting the jackpot are 1 in 13,983,816.
Probability Theory in Lottery Games
Probability just means how likely something is to happen, from 0 to 1. In lotteries, it tells you how often you might see your numbers come up.
Every lottery draw is random and independent. Past results don’t matter at all.
Every ticket, whether it’s your first or your fiftieth, has the same shot.
Let’s look at Powerball again—the jackpot odds sit at about 1 in 292 million. That’s a staggeringly low probability, honestly.
Understanding this can help you stay realistic and not fall for myths. “Hot” or “cold” numbers? They’re just stories people tell.
Combinations and Their Role in Winning

Combinations are just the different sets of numbers you can choose. They show how many possible outcomes exist, which sets your odds.
If you buy a few different tickets, your chances go up a smidge, but the total number of combinations is so huge, it barely makes a dent.
For example, if you buy 10 different tickets in a 6/49 lottery, your odds jump to 10 in 13,983,816. Still tiny, but hey, it’s something.
Some people join groups or use wheeling systems to cover more combinations. That can help you snag small wins, but don’t expect a jackpot guarantee.
Comparing Odds Across Different Lotteries
Lotteries all have their own odds, depending on their rules. The number of picks and the size of the pool change your chances.
Check out these examples:
| Lottery | Numbers to Pick | Total Numbers | Odds of Jackpot |
|---|---|---|---|
| 6/49 Lottery | 6 | 49 | 1 in 13,983,816 |
| Powerball | 5 + Powerball | 69 + 26 | 1 in 292,201,338 |
| LOTTO 7/39 | 7 | 39 | Lower than 6/49 |
Powerball makes things harder by adding extra numbers and steps. That’s why the jackpots get so huge, but winning is nearly impossible.
If you know the odds for each game, you can pick what fits your style. Smaller lotteries offer better odds but smaller prizes, while big ones dangle giant jackpots with almost impossible odds.
What Influences Your Chances of Winning
A few things shape your odds in the lottery. The jackpot size, how you pick your numbers, and how many tickets you buy all play a part.
Knowing these factors helps you make smarter decisions.
Jackpot Size and Its Effect on Odds
The jackpot size really affects how tough it is to win. Bigger jackpots, like Powerball, usually come with much worse odds.
For Powerball, your chance is about 1 in 292 million.
Smaller games, like the 6/49 lottery, give you slightly better odds—about 1 in 14 million for the jackpot.
Still hard, but not quite as wild as Powerball.
When jackpots get huge, more people play, so if you do win, you might have to share. Smaller prizes are easier to win, but the big prize odds stay tough no matter what.
Number Selection and Common Myths
How you pick your numbers doesn’t change your odds. Every combination is just as likely as any other.
People love to talk about “hot” or “cold” numbers, or lucky numbers, but these don’t actually affect anything.
Each draw stands alone. Previous winning numbers don’t influence what happens next.
If you pick common sequences like birthdays, you won’t hurt your odds, but you might have to split the prize if you win. Using random or varied numbers won’t boost your chances, but it could help you avoid sharing the jackpot.
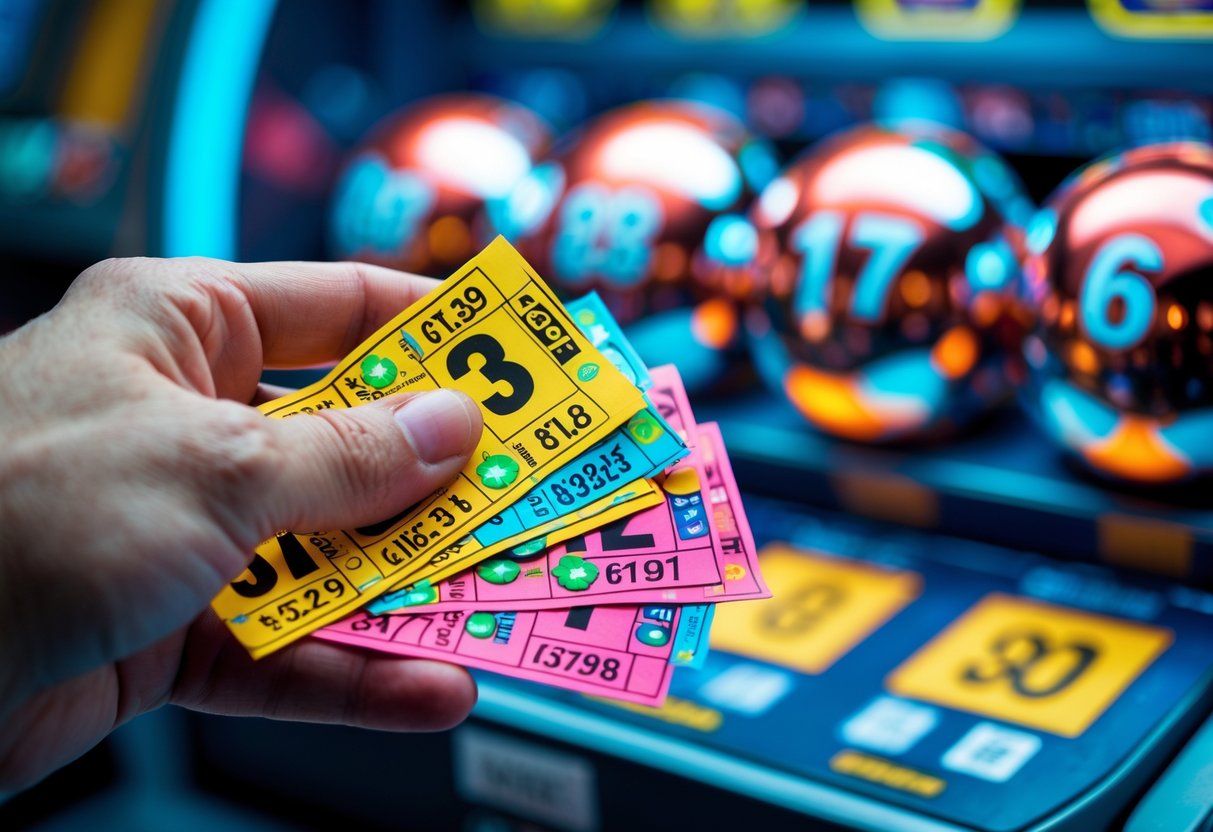
Buying Multiple Tickets: Does It Help?
Buying more tickets bumps up your odds, but honestly, not by much. If you’re staring down a 1 in 14 million shot in something like 6/49, grabbing 10 tickets just nudges your odds to 10 in 14 million.
Sure, more tickets equal more chances. But the improvement? It’s really just a small, steady increase.
You’d need to buy a mind-boggling number of tickets to actually guarantee a win. That would cost a fortune and, let’s be real, isn’t practical.
Some people try systems like lottery wheeling. These cover lots of combinations and might help you snag smaller prizes.
Still, no matter how many tickets you buy, you can’t guarantee the jackpot. It’s smart to keep your spending in check and see those extra tickets as a tiny boost—not a magic trick for winning.
Editor’s notes
Working with numbers regularly has taught me that the first impression is almost always incomplete. I’ve learned this the hard way while trying to interpret datasets for NumInsight. A trend might look strong at first glance, but when you revisit it a week later, everything shifts. These experiences taught me to be patient and let the data unfold before deciding what it means. This article reflects those lessons—moments where careful observation made more sense than rushing to an answer.